Monday Board vs Dashboard in Monday.com – what they are and when to use them
In this article I am going to explain the differences between Boards and Dashboards in Monday.com, when to use each of them and why.
To make the concepts in this article more visual and easier to understand, I will use data from my own Monday.com account every step of the way as a real life example.
A quick overview of the Monday.com hierarchy and terms
(If you already have a good grasp on Monday’s core features and terminology, you can skip this section).
Firstly, it’s important to understand the way data is organised in Monday.com and some commonly used terms.
Account
Your Account is what you create when you sign up to Monday.com and it contains all of your data, users, etc. And yes, you can have data pertaining to more than one business contained within the one Monday.com account.
My Monday.com account has the url https://botsquad.monday.com so every board, view, folder etc in it will have a url starting with that. I have 2 businesses, BotSquad and Fallon Photography. I actually use Monday.com to manage all the data for both businesses and it handles it really well. For example, I have a board for all my Photography Deals and another board for all my BotSquad/non-photography Deals. And because I can connect multiple Gmail accounts to the one Monday.com account, it is easy for me to choose which email address I want to use for a particular email or even email automation. Ditto for Google Calendar.
Users & Guests
Depending upon which Plan you are on, you can invite one or more Users (paid) and Guests (unpaid) to your account.
I only have one user in my account – me. (Note that I haven’t had to create a second user for myself in order to manage 2 brands within the one Monday.com account).
There are several guests that I have invited to various documents in my account at one time or another.
Workspaces

You can have one or several Workspaces in your account and use them to collect together and organise Folders, Dashboards, Boards and Docs.
I have many many Workspaces in my account, but for this example I am focusing on the Workspace called “Monday.com Kitset”.
Folders
Within each Workspace, you can create one or more Folders and use them to group together and organise Boards and Docs. The Folder we are working with in this case is called “Monday.com Kitset”.
Dashboards – standalone Dashboards
There are actually 2 different types of Dashboard in Monday. One is what I call a Standalone Dashboard and these are visible here at the Workspace level and also in your sidebar. Note that these Dashboards cannot be stored within a folder. (This is probably because they are able to pull data from more than one Board and therefore should “stay neutral” and be visible and available at all times in the Workspace rather than be hidden away in a folder).
The other type of Dashboard is actually a Board View and we will cover that with examples later within the Boards section.
Monday.com Dashboards are hugely customisable and allow you to choose from and add a large selection of widgets.
The most popular widgets are;
- Battery
- Calendar
- Chart
- Workload
- Numbers
- Gantt
But there are many many others to choose from in the Widget Centre.
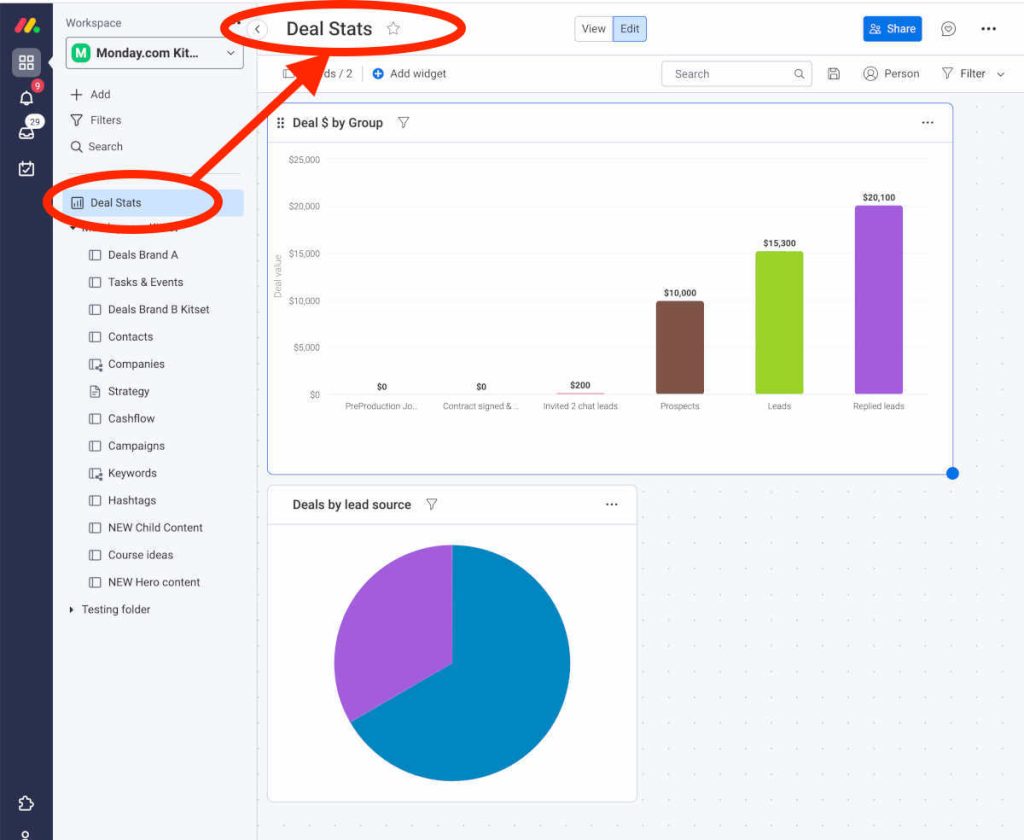
The standalone Dashboard I will use for this article is called “Deal Stats” and it is located in the Workspace “Monday.com Kitset”. I have set this Dashboard to collect data from 2 Boards “- Deals Brand A” and “Deals Brand A”.
Dashboard Widgets
Each Dashboard, whether standalone or a Dashboard View, can contain a wide array of highly visual graphs and charts such as pie/bar charts, numbers, Gannt etc.
In my standalone Deal Stats Dashboard, I only have 2 widgets. One is a pie chart called “Deals by lead source” and the second is a bar chart called “Deal $ by Group”.
Boards
Boards, like standalone Dashboards, are visible at the Workspace level. However, Boards unlike standalone Dashboards can be stored within a folder.
Within the “Monday.com Kitset” folder we are using for this example, there are 14 Boards, 1 (standalone) Dashboard and 2 Docs (more on those another time).
The Board we are going to focus on for this example is called “Cashflow”. I use this board to update my cashflow forecast semi-automatically
Automations & Integrations
Each Board can have multiple custom Automations and Integrations and they apply to every View within that Board.
The simple way to understand the fundamental difference between automations and integrations in Monday is this;
Integrations connect data in Monday to data in a third party App or vice versa.
Automations create or modify data within Monday.com itself.
An example of an Automation within this Board is this; whenever the Paid Status of an item is marked as Paid, the item is automatically moved to the Group called “PAID” thereby automatically updating the cashflow forecast.
In Monday, Board Automations can even be used to create items in a completely separate Board and then connect the related data in each Board to each other. In fact, many of the items in this Board were created by an automation in the Deals Brand A and Deals Brand B Boards. The automations in question actually reside in the source (Deals) Boards and they add an income item to the Cashflow Board whenever a new Deal is created.
Groups
You can create multiple Groups within a Board and use them to organise multiple items within that Board. You can also either trigger automations when items are moved to a Group or you can create an automation to move items to a Group when a certain Trigger fires and (optionally) certain conditions are met.
I have created 8 Groups in this Board with titles such as “Quotes & Drafts”, “Due this month”, “Cancelled / Lost”, “On Hold” and “Paid”. Although some of these Groups might not be visible in some filtered Views, all Groups in a Board are available and consistent within every View within that Board.
When an item (income or expense) is marked as paid, it is moved to the Paid Group so the forecast is always based on the latest balance you have manually entered/adjusted and whatever income and expenses you have not yet paid/marked as paid.
Views
You can add multiple custom views within any Board to show only the info you want to see displayed in the way you want to see it.
When you create a new Board in Monday, by default it is always a Table View and this default Table View always shows every single item and every single Group and column in the Board. You can filter out items and columns, groups etc but this filtering is only temporary when it comes to the default Main Table. Ie you can save the filtered View as a new View but you can’t save the Main Table with this filtered View.
This is because this Main Table is all about complete transparency.
Other types of popular Board Views in Monday include;
- Dashboard. The Dashboard View is the second type of Dashboard we referred to earlier in this article. Because it is a type of Board View it is intrinsically tied to the Board in which it was created and – unlike the standalone Dashboard – can only pull data from the one Board in which it resides.
- Chart
- Kanban
- Gantt charts
- Cards
- Form
- Files Gallery
- Workload
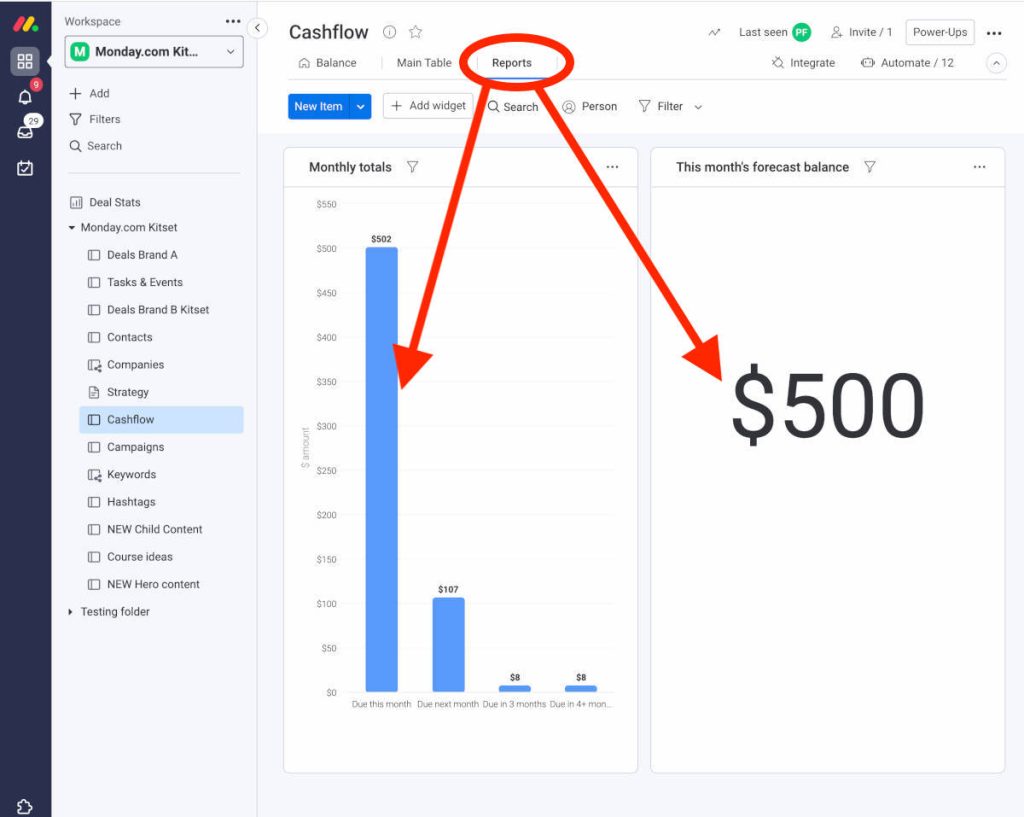
Within the Cashflow Board, I have the original “Main Table” and I have also created 2 additional Board Views called “Balance”and “Reports”.
Main Table
Main Table was the original default view when I created this Board and as such always displays every column and item. (I have since set the “Balance” view as the default view).
Balance
I wanted a simpler view of the Cashflow Board so I filtered out all but the most essential columns and saved this filtered view as a new View called Balance. Note that the visible columns in this View are displayed in a different order to how they appear in the Main Table. In other words, yes, you can customise the order the Columns are shown in in each View.
Reports (Dashboard View)
This “Reports” Dashboard View contains one Bar Chart and one numbers Widget. The Bar Chart shows the forecast final balance for each month/Group. The Numbers Widget shows a simple number total reflecting the forecast final balance for the Group “This month”.
I could add countless other other widgets if I wanted to but for this example I wanted to keep things simple.
Columns
Each Board/Board View can contain many different types of columns, each with different formats and functions.
The most powerful column types are;
- Status. The Status Column is one of the most powerful and popular in Monday.com because it is the most versatile when it comes to triggering Automations.
- Connect Boards. This type of column is hugely powerful because it allows you to connect data in two completely separate Boards and even create new data in Board Y based on triggers and conditions in Board X. Many of the items in the Cashflow Board were actually created by an Automation in one of the Deals Boards that not only created the Cashflow items but also included a Connected Board column in both items/Boards so that the two items in separate Boards were then connected via a Connected Board column.
- Mirror. When you have a Connected Board column you have the option of adding one or more Mirror Columns that pull more data from the same Item/Board where the item in the Connected Board Column lives.
The next most popular column types are;
- Text
- People
- Dropdown
- Date
- Numbers
- Files
- Last Updated
- Timeline
- Formula
We are going to focus on the Main Table View for this example.
The Columns in this Main Table Board View are Person, Due Date, Day of Month, $ amount, Paid $, Paid date and Payment Status.
Items
The individual lines in every Monday.com Board represent a group of related data that is collectively referred to as an item in Monday.com.
As an example from our Main Table, within the Group called “Due this month” the first item is called “start balance this month” and has a $ value of $1,000. Below this is an item called “Recurring bill D” with a value of -$500.
The Start Conversation Button.
Every item in Monday.com always has a Start Conversation button (speech bubble icon with a cross inside the speech bubble. If there has activity within the past 7 days, there may even be a number in blue overlaid over the Start Conversation Widget).
Within the pop-up Start Conversation window, some very powerful widgets and features are hiding…
When you open up the Start Conversation you will always see the following default widgets;
- Item Card (note that you can add multiple Item Cards and choose which columns to show or now show separately within each Item Card).
- Updates
- Files
- Activity Log
- Info Boxes
But you can also add many other types of Widgets such as;
- Emails & Activities,
- Quotes & Invoices
- Sub-item templates
- Google Ads Management
- Plus a whole host of paid Marketplace Apps.
Let’s take the item from the Main Table Board View of the Cashflow Board and really drill down into it.
Example Item
Let’s look at “Recurring bill D” in the Group “Due this month”. The column values for this item are;
- Item name – “Recurring bill D”
- Day of month – 30
- Paid date – empty
- Payment status – Not paid
- Due Date – 30 June 2022
- $ amount- -$500
If we click on the Start Conversation button, we can also find the following info;
- There is a file added to the files Widget
- There is a comment added to the Updates Widget (to myself as there are no other users but this is where you could have an internal team chat with any other team members regarding this item).
- Meeting notes (or emails or call summaries) in the Emails & Activities Widget.
You might also enjoy this blog post
If you found this blog post helpful, you might also enjoy this blog post I wrote about the Monday.cam Desktop App for Mac.
Summary
By now, you should have a clear understanding of how and where information is stored and displayed within your Monday.com account and how Boards, Dashboard Views and standalone Dashboards fit into this system.
Now, let's laser in on the question that prompted this whole article...
"What is the difference between a Monday.com Board and a Dashboard?".
Let's tackle that question and the whole Monday board vs dashboard debate now.
A Monday.com Board is essentially a database that contains a collection of related data.
Each board and the columns and items it contain can be used to represent practically any type of data you can imagine and this is one of the things that makes Monday.com both incredibly powerful and also rather hard to wrap your head around when you first start using it.
In our example, the "Cashflow" Board reflects our cashflow forecast and each line or item within that Board reflects one single expense or invoice/income item. The Groups within the Board reflect either different months (Due this month, Due next month) or other payment statues (Quotes & Drafts, Cancelled, Paid etc).
The columns within the Board or Board View give us more detailed information about each item.
For example we have the item "Recurring bill D" and the values in the various columns within this item give us more detailed info about it. We can see that this bill has a value of -$500, it hasn't been paid, it's due on the 30th of June 2022 etc.
When we take a step back and look at the Main Table View of the Cashflow Board, because it shows all the data at a glance, it provides complete transparency and allows us to get an instant high level snapshot of our cashflow.
Not only this, but because automations and integrations live within Boards in Monday.com, Boards are where the magic happens in terms of automating our processes and saving ourselves a tonne of time.
But what about Dashboards? What are they for?
Monday.com Dashboard Overview
The two fundamental characteristics that differentiate Dashboards from Boards in Monday are as follows;
- Dashboards do not themselves contain data - they are dependent upon a Board or Boards and the data they contain to generate their charts, numbers and other widgets. So, you always need to start with a Board before you create a Dashboard.
- Dashboards display complex information simply and graphically for instant understanding. But this simplicity also hides the high level view that Boards provide.
The two different types of Dashboard in Monday and their differences make it very clear which type of Dashboard to use when. The Dashboard View is a Board View and can only pull data from one Board, so is the logical choice for Board level reports/dashboards.
The standalone Dashboard can pull data from multiple Boards and even Workspaces and is always visible in the sidebar/at the Workspace level. This makes it the obvious choice for big picture multi-board Reports and Dashboards.
Monday Board vs Dashboard - when to use them and why
Hopefully, by now the answer should be fairly obvious.
In Monday.com you always start with Boards and Boards are essential when it comes to transparency, getting a high level overview of your business/project and automating processes to save time and increase efficiency.
Once you have your Boards set up to capture and represent all the data you need, then and only then can you create Dashboards or Dashboard Views to make interpretation of all the data simpler and more visual.
In short, start with Boards for overview and automations and add Dashboards for easier interpretation of the data.
I hope you found this article helpful. If you did, please let me know with a comment or a follow on social media.
Pre-register for our Monday.com Micro Courses Now
We are nearly ready to launch a series of Monday.com Micro courses soon. Pre-register here to be updated when they are ready to launch.

0 comments